Jupiter Io-B on 2 December 2011
This was a late-afternoon pass. We used two Icom R-75 HF
Receivers, one tuned to 19.6 MHz (LSB), corresponding to the Red trace in the charts below,
and the other tuned to 20.6 MHz (LSB), corresponding to the Green trace.
The receivers were connected to the antenna through a multicoupler. The antenna
was an 8-element log periodic antenna pointed about 96 degrees true (no tracking
was used). The ambient RF noise level in this direction was slightly over 300k K during
the observation.
The predicted activity included an Io-B enhanced storm from about 0105 to 0345. We did not detect activity until approximately 0215. The storm lasted about 25 minutes, starting with weak bursts and reaching a peak around 1039 with a very strong burst of about 2500k K. Neither frequency was preferred, although the highest intensity was received at 20.6 MHz. Spectrograms (not shown) indicated emissions covering a wide band
The Jupiter Radio Map is for reference and shows the orientation of the Io-B enhanced source at the observation time. We observed mostly L-bursts. Links to stereo and mono sound files of the bursts are provided below the charts. Headphones are recommended. All times and dates are UTC.
At the time of the charts Jupiter was at azimuth/elevation of approximately 96 degrees true and 15 degrees above the horizon.
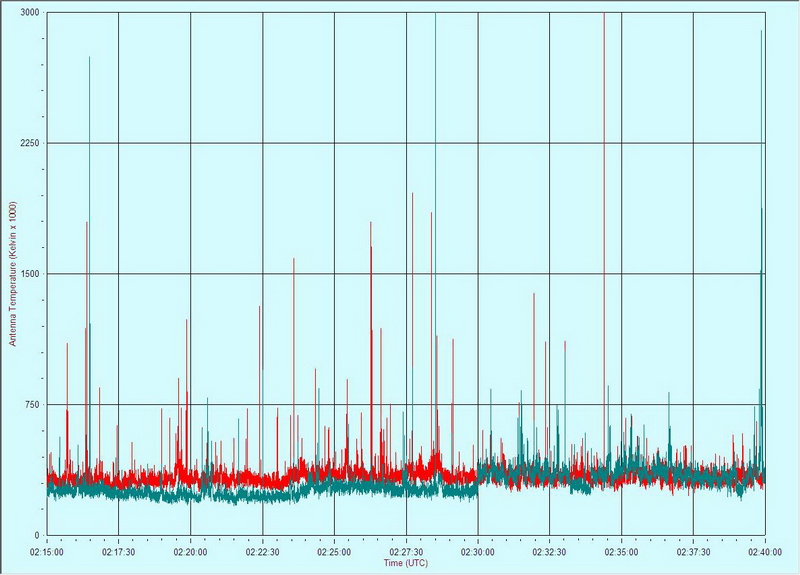
The above chart shows the active period from 0215 to 0240. Most bursts were fairly weak, but there was one very strong burst at about 0239:50 that exceeded 2500k K (see below).


Click here to listen to a mono sound file corresponding to the bursting period associated with the blue trace in the chart above. There are three distinct burst events.


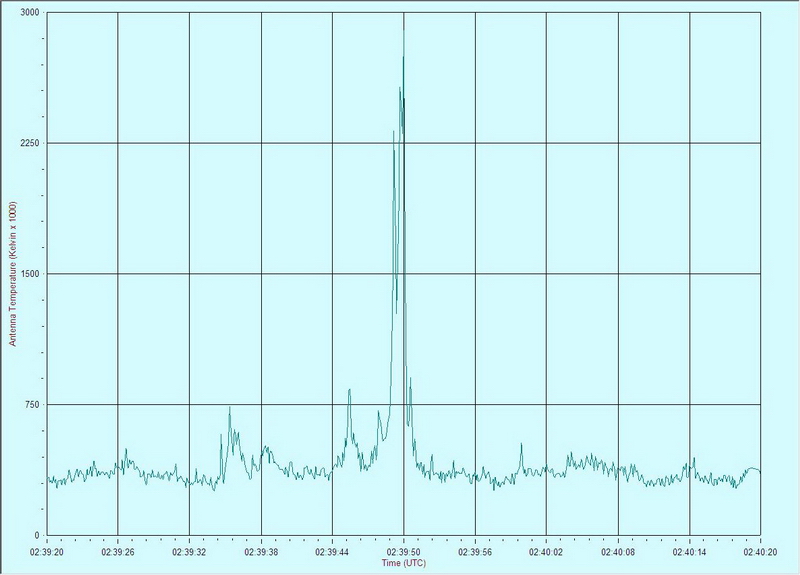
Note scale change. The above chart shows the strongest burst during the observation period, almost 2500k K. Click here to listen to a stereo sound file for the period of bursting in the chart above.